Each time a request is processed by the ASP.NET processing engine a metric is recorded with the total time for the request and the time for each stage of the ASP.NET pipeline.
What Data is Captured by the Page Hit Metric
The Page Hit metric captures several values for every request to the ASP.NET engine.
| Caption | Type | Description | Summary Function |
|---|---|---|---|
| Page | String | The page name without path | Count |
| Absolute Path | String | The full path from the root of the web site to the page that was requested including the page | Count |
| Query String | String | The query string used for the request | Count |
| Total Request Duration | Double | The entire time it took for the request to be satisfied | Average |
| Authenticate Request Duration | Double | The time it took for the request to be authenticated | Average |
| Authorize Request Duration | Double | The time it took for the request to be authorized | Average |
| Resolve Request Cache Duration | Double | The time it took for the request to be looked up in cache | Average |
| Acquire Request State Duration | Double | The time it took for the request state to be acquired | Average |
| Request Handler Execute Duration | Double | The time it took for the request handler to execute. This includes the time for most ASP.NET page code. | Average |
| Release Request State Duration | Double | The time it took for the request state to be released | Average |
| Update Request Cache Duration | Double | The time it took for the request cache to be updated | Average |
| Log Request Duration | Double | The time it took for the request to be logged | Average |
| Cached Response | Boolean | Indicates if the response was served from the output cache instead of being generated. | Average |
The captions align with the ASP.NET documentation for the various phases of processing a request and are listed in order above. Most code written for ASP.NET is executed in the Request Handler phase and counted as the Request Handler Execute Duration. If a response is returned from the ASP.NET output cache then the request handler is never executed and the Cached response value is true.
Charting and Graphing the Page Hit Metric
First, locate the Page Hit Metric in the session you're interested in:

Selecting the Page Hit Metric |
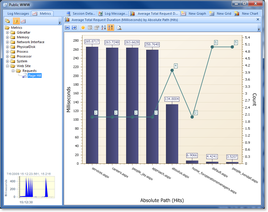
You can then drag the metric onto a new graph or chart to analyze different information. For example, if you chart the Average Total Request Duration by Absolute Path with a secondary plot of the number of hits you get the following chart:

Example Page Hit Metric Chart |