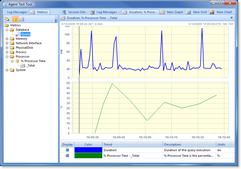
Loupe provides a flexible method for recording a range of application metrics. This capability is used automatically by the Loupe Agent to store performance counter data retrieved from the Windows Performance Monitor infrastructure and can be used in your application to provide custom metrics to:
- Record Feature Usage Information: Store information each time an application feature is used, including how long the feature took to execute and other useful attributes.
- Record Performance Information: Store key performance metrics for your application with more detail and through an easier API than Performance Counters.
- Provide numeric data for analysis: In general, the metrics system is designed to let you easily store numeric data to be analyzed later.
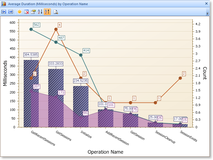
By creating custom application metrics, you make it easy to create insightful charts and graphs that can effectively communicate how your software is used and what the opportunities are for improvement.
Where would you like to go next?
- To understand what performance information the Agent will record by default, see Developer's Guide - Metrics - Performance Counters.
- Loupe supports two different ways of capturing metric data to provide the best analysis and flexibility for your application. See Developer's Guide - Metrics - Sampled and Event Metrics for details on the two models of metrics and how they can help your application.
- For details on the conceptual data model for metrics, see Developer's Guide - Metrics - Object Model.
- The entire API for Metrics is in the Loupe Agent in the Gibraltar.Agent.Metrics namespace.
Storage Size
Loupe uses a highly compressed storage format designed to efficiently compress both strings and numbers. Individual metric samples are very small, even for event metrics that record several values because of de-duplication techniques in the data storage format. All of this is done transparently by Loupe after your sample has been handed to it, ensuring your application can continue working without interruption.
Performance
Metrics are recorded asynchronously in a thread-safe manner that is designed to minimize any interruption in your application. While the specific overhead will vary by the processing capacity of the client computer, a modest computer can record thousands of samples per second on a single thread. Because of this performance it is reasonable to record extensive metrics for your application without reducing its scalability or user-perceived performance.

