Log Messages Viewer Introduction
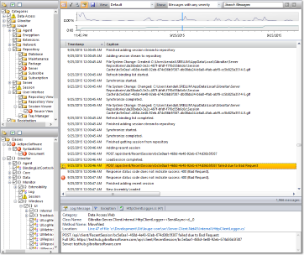
When the Session Viewer first opens most of the screen area is taken up by the Log Message Viewer:

Session Viewer - Log Messages |
The Log Message Viewer is divided up into several individual controls:
| Control | Default Location | Description |
|---|---|---|
| Categories Explorer | Left Pane Top |
An explorer view of all the categories used by log messages in the current session. Each log message is related to a category in the category hierarchy. The categories explorer is hidden by default and must be selected at the lower left to become active. By checking or unchecking the box next to a category you can hide all of the related log messages. The messages related to the selected node are highlighted in blue. For more information on filtering with the Categories Explorer, see Filtering Messages. |
| Classes Explorer | Left Pane Bottom |
An explorer view of all the classes that recorded log messages in the current session. The hierarchy is determined by the namespace of each class. By checking or unchecking the box next to a namespace or class you can hide all of the related log messages. The messages related to the selected node are highlighted in blue. For more information on filtering with the Classes Explorer, see Filtering Messages. |
| Resource Graph | Top of the center pane |
A graph that summarizes up to four key performance metrics over the life of the process: Disk, Memory, Network, and Processor usage. Memory and Processor usage are shown by default. To display Disk and Network usage, right click on the Resource Graph and select the metric you want to add or remove from the graph. Sessions that run for a very short period of time (less than two minutes) may not have any metric data to show.
You can expand the height of the Resource Graph by dragging its lower border down.
The Resource Graph can be hidden by clicking a button in the tool bar. Once hidden it won't be displayed automatically for future sessions, but can be displayed at any time.
|
| Dynamic Filter Editor | Second in the center pane |
A graphical tool for creating log message filters. As you edit the filter clause it is applied to the log message grid. The Dynamic Filter Editor can be hidden by clicking a button on the tool bar. Once hidden it won't be displayed automatically for future sessions, but can be displayed at any time. Hiding the filter editor does not affect the filtering of the grid. For more information on using the dynamic filter editor, see Filtering Messages. |
| Group-by Box | Third in the center pane |
Dragging column headers from the Log Message Grid into this box will group the log messages by that column, in order. Clicking on columns in the group by box will change the sort order. Grouping is a very quick tool for analyzing the contents of a log. For example, grouping by Severity and Caption can quickly show all of the unique errors with a count of how many times each occurred. To stop grouping by a column, drag it out of the box. The Group-by Box can be hidden by clicking a button on the tool bar. Once hidden it won't be displayed automatically for future sessions, but can be displayed at any time. Hiding the Group-by Box does not affect the grouping of the grid. For more information on grouping and sorting columns, see Grouping and Sorting. |
| Log Messages Grid | Fourth in the center pane |
The Log Messages Grid displays the individual log messages in a flexible grid format that supports:
|
| Message Details Pane | Bottom of the center pane | A tabbed view of the details for the current log message selected in the Log Message Grid. The Message Details pane can be hidden by clicking a button on the tool bar. Once hidden it won't be displayed automatically for future sessions, but can be displayed at any time. For more information see Loupe Desktop - Log Message Details. |