Repositories
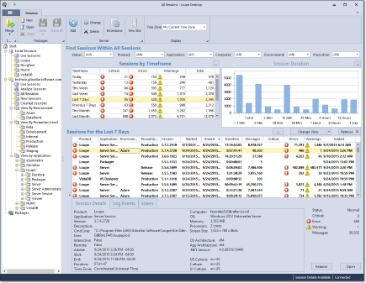
When you click on a repository node in the tree view or any folder the start page is replaced with the repository view, showing information on all sessions contained in the selected node and any folder it contains.

Gibraltar Application Monitor - Repository View |
By default, the view contains all sessions for the selected folder and all folders it contains. The view is composed of four areas:
- Filter Your View: You can filter the sessions contained in the view by status, product, application, computer, environment, and promotion level.
- Summary Views: Up to three interchangeable session summarization views can be selected to display. The number of summaries displayed depends on the width of the application window. Each view supports selecting a set of sessions (by clicking on a bar for a bar chart, row for a grid, and pie section for a pie chart). All of the matching sessions will be displayed in the session list.
- Session List: The list of all sessions contained in the summary view. You can open a session by double clicking it in this list. You can copy one or more sessions by highlighting them and dragging them into the folder or repository that you want to copy them into.
- Session Detail Views: One of three interchangeable views that drill into the session selected in the session list.
Once you've found a session you want to drill into, you can open it using the Open button in the lower right or by double-clicking it in the grid. This will display it in the Session Viewer.
Session Summaries
There are multiple different session summaries that can be displayed in the summary view area. Depending on the screen space available to the summary area up to three different summary views can be displayed at the same time. When a summary view is selected it determines which sessions are displayed in the sessions list. Each summary view supports filtering down the list of sessions further as you select different elements in the view.
Selecting Summary Views
To change any of the displayed summary views to a different view, click on the change view button (...) in the upper right hand corner of the view you want to change and select a new view from the list of available views. Not all views are available in each slot for presentation & formatting reasons.
Available Summary Views
The built in summary views are:
- Sessions by Time Frame: A grid of different relative time frames in comparable pairs (today, yesterday, this week, last week...) with the number of sessions, log messages, critical messages, error messages, and warning messages of all sessions in the time frame. Select any single row to see the session information.
- Sessions by Application: The number of sessions for each application that has any sessions recorded.
- Sessions by Operating System: A pie chart of the number of sessions for each operating system family. Select a given pie segment to see all of the sessions on that operating system.
- Sessions by Duration: A bar chart of the number of sessions by duration. Each duration contains the sessions that lasted at least as long as indicated but not into the next segment. Select a bar to display all of the sessions within the duration range.
- Severity by Application: A bar chart of the number of sessions with warnings, errors, or critical messages for each application. Select a bar to see all of the sessions for the selected application with the selected message severity.
Adding your own Views
You can create your own summary views by creating a Session Summary View Extension. These custom views extend the selection menu and can be displayed in any position.
Sessions List
Below the set of summary views is a list of all of the sessions that match the selected summary view. With each session listed you can perform a range of tasks such as opening, removing, and marking the session as read.
Selecting Session List Views
The sessions list also supports several built-in views that can be useful for finding the sessions you're interested in. The available views are:
- By Environment: Groups all of the sessions by their environment.
- By Promotion Level: Groups all of the sessions by their promotion level.
- By Application: Groups all of the sessions by their product then application.
- By Computer: Groups all of the sessions by their Hostname (without domain)
- By User: Groups all of the sessions by their user name (without domain)
- By Added Date: Groups all of the sessions by their added date (when they were added to Loupe Desktop) using Outlook-style date groups (with small date intervals for recent dates and longer intervals as time passes)
- By Start Date: Groups all of the sessions by their start date using Outlook-style date groups
- By End Date: Groups all of the sessions by their end date using Outlook-style date groups.
If you manually modify the grouping and sorting of the grid you can re-establish the view by re-selecting it or by selecting the default view.
Session Detail Views
By default the session summary information will be displayed showing the set of common data elements collection on every session.

Session Detail View - Session Details |
In the User Repository you can also select two additional views that show the errors within the selected session. Just select the tab you're interested in to switch

Session Detail View - Errors by Category |