Using Loupe with Entity Framework - Analyzing Performance
In This Topic
Every operation performed by Entity Framework against a data store records a performance metric. These metrics are available under the category Database->Query.
You can select this metric and drag it onto a new Graph, Chart, or Grid view to analyze its information.
Top Query Charting
To quickly determine what database operations are affecting your overall application performance the most you typically want to identify the slowest operations - either slowest execution time or total time spent executing that operation. For example, a query that is relatively fast but executed an excessive number of times may add up to the biggest time consumer in your application.
To see this analysis:
- Open a session
- Click the New View tab button
- Select New Chart in the New Session View dialog
- Drag the Query metric onto the newly created view
- In the Create Metric Chart dialog select Group By: Query Name and Chart: Total Duration. Check the option to limit to the top 10 results.
- Click OK to see the analysis
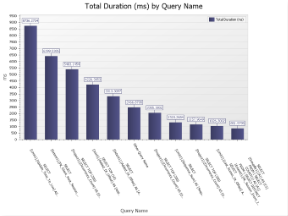
You will see a chart like the following where the bars represent the total time executing a given operation over the entire session.

Total Duration by Query Chart
|
For added clarity on which operations are slow vs. which are being executed many times:
- Click the Add Metric Series toolbar button
- In the Create Secondary Chart Series dialog select Chart: Count of Events.
- Click OK
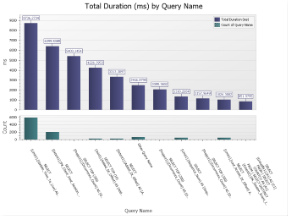
You'll now see a chart with the execution counts for each operation. Where the bar is high it means an operation was executed many times.

Total Duration and Execution Count by Query Chart
|
When you see a query executed dramatically more times than its peers this often indicates Entity Framework Lazy loading is inefficiently loading the information or you should consider caching it so it doesn't have to be retrieved as often. No query is faster than the query you never make.
For more information on how to use metric charting to analyze data see
Loupe Desktop - Metric Chart.
Data Access Performance over Time
Sometimes performance is bound by external factors - such as other applications accessing the same database servers. In these cases, the performance of a query is varying not by different inputs but instead just by when it was run. To see an overview of the response time of all queries by time you can use the Metric Graph feature:
- Open a session
- Click the New View tab button
- Select New Graph in the New Session View dialog
- Drag the Query metric onto the newly created view
- In the Add Metric To Graph dialog check the Display box next to Duration
- Click OK to see the analysis
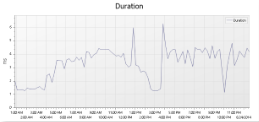
This will display a default analysis of the duration over time. The line represents the average query duration during the time window; investigate time periods where it is unusually high which may indicate contention with other applications.

Query Duration over Time Graph
|
If you also have the Loupe Agent for ASP.NET recording information you can add the Total Request Duration from the Web Site -> Page Hit metric to see the correlation between web server response time and database query time.
Viewing All Metric Data
To see a dump of all the metric data for EF operations (which you can then analyze and export):
- Open a session
- Click the New View tab button
- Select New Grid in the New Session VIew dialog
- Drag the Query metric onto the newly created view.
By default you'll get a grid of every EF operation, in order with the complete SQL Statement (the Query Name column), parameter information, Row count, the duration and Success if no exception was thrown or the exception type if the operation failed.
You can take this information and group by various columns, filter the grid, and export it to Excel. For example, by grouping by Query Name and selecting Analyze Duration in the toolbar you'll see statistical information on the average, total, minimum, and maximum query time for each distinct operation.
If there is significant variation for a single SQL Query review the Parameters column to see if it correlates to different input values changing the performance characteristics.
See Also


