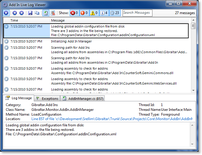
The best way to monitor and troubleshoot your extensions is by using the integrated Extension Log Viewer from within Loupe Desktop. You can display this by selecting Show Log Viewer from the backstage area. This will display an instance of the Live Log Viewer specially configured to just show extension related items.

Extension Log Viewer |
You can leave this viewer up while running Loupe Desktop to see traffic for your extension as well as all of the other Extensions and internal activities of Loupe Desktop itself that directly relate to processing extensions.
Logging from Your Extension
Because you cannot access the Loupe Agent from within an extension an alternate method of recording log entries has been provided within the API. Each object is provided an Extension Context that exposes an ILog implementation through its Log property. Using this object you can record log messages substantially the same way you would call Agent. The big difference is that the category "Extension" is automatically added to every log message to ensure they group together within the Loupe Desktop logs and can be displayed in the Extension Log Viewer.
Handling Errors
In many cases the best strategy is simply to throw the exception and let it be caught by Loupe. The exception to this is in user interfaces where the exception would be handled by .NET. Loupe is ready for exceptions inside of extensions and works to do the best thing, such as not displaying the view or loading the component that isn't working. The exceptions can be viewed in the Extension Log Viewer.
If you suspect a problem with the server-side extensions (Session Analyzers and Repository Extensions) you will need to use Loupe Desktop on the Server computer and review the saved logs.