Loupe Desktop - Log Message Details
In This Topic
Log Message Details Pane
Whenever a log message is selected in the Log Messages Grid its details are available in the Log Message Details Pane:
There are up to four tabs that display different types of information.
If you don't see one or more of the tabs it's because no log messages in the current log have information in that section.
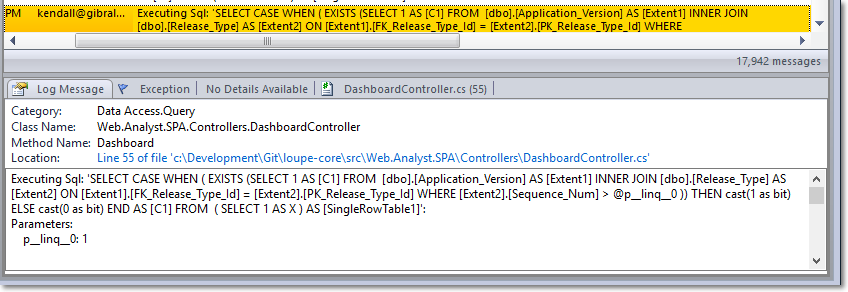
Log Message Tab
| Field |
Availability |
Description |
| Class Name |
Generally present. |
The full name to the class that recorded the log message. |
| Category Name |
Generally present. |
The full name of the category that the message was recorded under. |
| Method Name |
Generally present. |
The name of the method that recorded the log message within the class. |
| Location |
Only Debug Builds |
If the assembly that recorded the log message was built with symbols and the symbol file (.PDB) was available at runtime then the line number and source code file information are available at runtime. The full path is based on the path on the computer where the assembly was compiled. If no location information is available, this field is not shown. |
| Thread Id |
Always Available. |
The .NET ID of the thread. The thread Id is unique for the lifecycle of a process and is useful for understanding how processing happened on multithreaded applications. |
| Thread Name |
Always Available. |
Each thread can be named by the application to display more user friendly information during debugging. Thread names are not necessarily unique. If no thread name was set by the application, the Thread Name is displayed as "Thread #" where # is the Thread Id.
All threads created by the Loupe Agent are given names that start with "Loupe". This is intended to assist in performance profiling and diagnostics by making it easy to eliminate them from the monitored application's own information.
|
| Thread Type |
Always Available |
Indicates whether the thread was a foreground thread (and therefore will keep the application running until it exists) or is a background thread. Background threads that are part of the .NET ThreadPool are further noted as "Background, Pooled". |
| Description |
Always available |
The full log message, displayed in a text box that respects line breaks and white space. |
You can select and highlight any value in the Details tab, allowing you to copy it to the clipboard and paste it into another application.
Expanding the Log Message
You can double-click a log message to display the Log Message Details in its own independent window. This is handy for very large messages or when comparing messages side-by-side.
Exceptions Tab
An exception can be recorded with any log message. Recording an exception doesn't affect the severity of the message - it is reasonable to have an exception recorded that was expected and just alters the flow of an application. Because exceptions are a frequent source of important defects and application health information they are recorded with additional information.
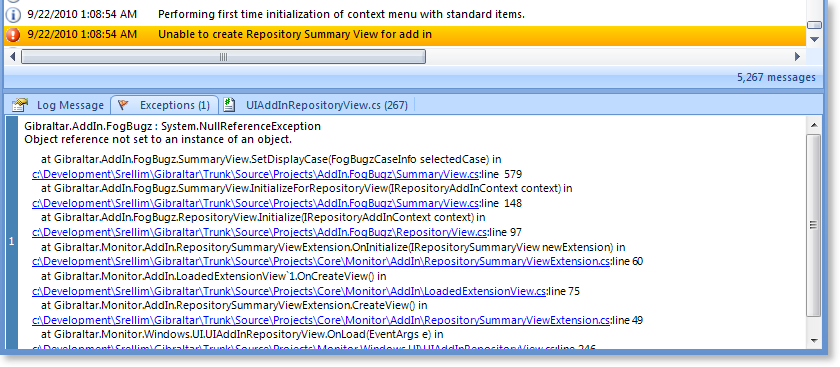
If no exception is present on the current log message the caption of the Exceptions tab will have a green flag. When an exception is present, the flag will be orange. Once you click on the Exceptions tab the exception stack will be displayed in a grid in tab. If the exception that was recorded wrapped an inner exception each will be logged with the outermost on top.
You can highlight any part of the exception message and copy it out.
Working with Multiple Exceptions
When there are multiple exceptions (e.g. the exception that was logged has inner exception) then they are numbered and displayed with the outermost/topmost exception on top and the innermost exception on the bottom. The number indicates the order they were thrown, with 1 being the innermost.
Working with Stack Traces
You can copy the entire stack trace of an exception by double-clicking on the stack trace. This is particularly useful for working with obfuscators that need to have the stack trace provided to their own custom tool to de-obfuscate the stack for you. If file location information was included in the stack trace it will be hyperlinked to the file location on your local computer (indicated in blue).
Exceptions frequently have long call stacks and may require more room to fully display. You can increase the size of the entire Details Pane by dragging its upper divider up.
Details Tab
Each log message can have an Xml block associated with it to provide structured detailed information. In a future release of Loupe Desktop it will even be possible to format this information within the Loupe Desktop using a custom Xml Stylesheet (XSLT). If no details are present for the current row this tab will be labeled "No Details Available". If no details are recorded for any log message in the current log then the tab will be hidden.
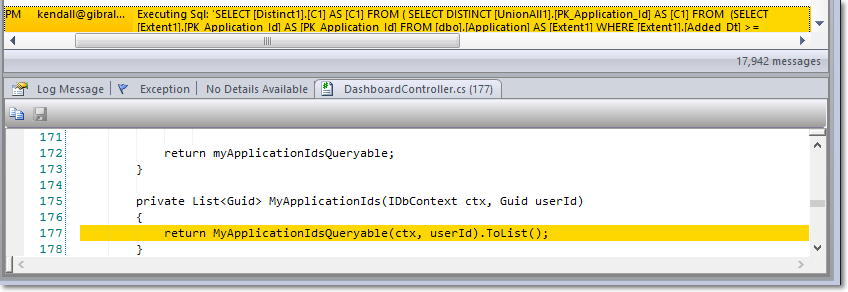
Source Code Tab
If source code location was recorded for the current message then this tab will indicate the file name and line number. If that file exists on the local computer then its contents will be displayed with the specified line number highlighted.
If no source code information is available for any log message in the current log then this tab will be hidden.
See Also