Metric Goals
In this example, we want to record performance data for every database query so that we can understand the impact of database performance on our application in production usage. We want to be able to:
- Know what queries are used most by users so we can locate queries that deserve special optimization as well as understand the opportunity for grouping queries together.
- Identify hot spot queries that are taking a long time with the real data sets used by customers.
- Identify reliability problems in database operations.
Metric Design
For every database call, we will record an event metric with several values:
| Name | Caption | Type | Description | Summary Function |
|---|---|---|---|---|
| queryName | Query Name | String | The name of the stored procedure or query that was executed | Count |
| duration | Duration | TimeSpan | Duration of the query execution | Average |
| rowCount | Rows | Int | The number of rows returned by the query | Average |
| result | Result | String | A display caption for the result of the query (such as Success or an error message) | Count |
By capturing this information, the Loupe Desktop can quickly show you a range of charts such as:
- Average Duration by Query: The average duration for each query (grouped by Query Name) that was run in the session.
- Result by Query: A bar chart of the number of different queries that produced each Result.
- Top 5 Queries: A pie chart with the top five queries.
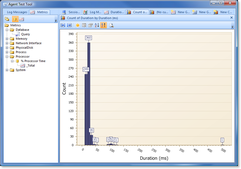
- Count by Duration: See the distribution of query duration to understand the variance from query to query.
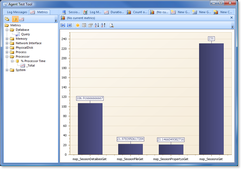
Example Chart: Average Duration by Query

Example Average Duration by Query Chart |
Example Chart: Count by Duration

Example Chart: Count of Duration |
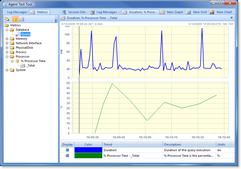
In addition to these charts, you can treat any value in an event metric like a sampled metric and create a graph of that value by time, such as:
- Average Duration by Time: Viewing across the life of the session, graph the average query duration.
- Average Rows by Time: Viewing across the life of the session, graph the average number of rows returned by a query.
In each case, you can then add other sampled metrics to the same graph such as processor or memory utilization.
Example Graph: Average Duration by Time

Examle Average Duration by Time Graph |
Metric Implementation
To record this metric we're going to use the declarative approach where we decorate an object with attributes that contain the metric definition, then populate the object at runtime with the values we want to record.
| Database Metric Data Object |
Copy Code
|
|---|---|
/// <summary> /// The metric data object that implements our database metric. /// </summary> [EventMetric("yourApplicationName", "Database", "Query", Caption = "Database Query Performance", Description = "Performance data for every database query")] public class DatabaseMetric : IDisposable { private readonly Stopwatch m_StopWatch; public DatabaseMetric(string query) { Query = query; m_StopWatch = Stopwatch.StartNew(); //by default assume we're going to succeed - that way we don't have to explicitly add this //to every place we record a metric. Result = "Success"; } [EventMetricValue("queryName", SummaryFunction.Count, null, Caption = "Query Name", Description = "The name of the stored procedure or query that was executed")] public string Query { get; private set; } [EventMetricValue("rowCount", SummaryFunction.Average, null, Caption = "Rows", Description = "The number of rows returned by the query")] public int Rows { get; set; } [EventMetricValue("duration", SummaryFunction.Average, "ms", Caption = "Duration", Description = "Duration of the query execution", IsDefaultValue = true)] public TimeSpan Duration { get; private set; } [EventMetricValue("result", SummaryFunction.Count, null, Caption = "Result", Description = "The result of the query; Success or an error message.")] public string Result { get; set; } /// <summary> /// Stops the timer and records the metric /// </summary> public void Dispose() { m_StopWatch.Stop(); Duration = m_StopWatch.Elapsed; EventMetric.Write(this); } } |
|
This example shows how an object that's decorated with event metric attributes can be more than a simple data holder. In this case the trick is to have the data object implement an automatic timer and record itself during the dispose. This allows for a convenient syntax to capture time as illustrated in the following methods:
| Database Command Methods that Record Metrics |
Copy Code
|
|---|---|
private DataSet ExecuteQuery(SqlCommand command) { DataAdapter adapter = new SqlDataAdapter(command); DataSet dataset = new DataSet(command.CommandText); //Execute the provided command wrapped in our metric using (DatabaseMetric ourMetric = new DatabaseMetric(command.CommandText)) { try { ourMetric.Rows = adapter.Fill(dataset); } catch (Exception ex) { //record the error info in our metric and then re-throw the exception. ourMetric.Result = ex.Message; throw; //this throw continues the previous throw so we don't alter the call stac. } } return dataset; } private void ExecuteNonQuery(DbCommand command) { //Execute the provided command wrapped in our metric using (DatabaseMetric ourMetric = new DatabaseMetric(command.CommandText)) { try { if (command.Connection.State != ConnectionState.Open) command.Connection.Open(); ourMetric.Rows = command.ExecuteNonQuery(); } catch (Exception ex) { //record the error info in our metric and then re-throw the exception. ourMetric.Result = ex.Message; throw; //this throw continues the previous throw so we don't alter the call stack. } } } |
|
In our sample application we route database queries through these wrapper methods to automatically record the metric we want on every database call. By having the DatabaseMetric object implement IDispose it can take advantage of the automatic infrastructure provided by the using statement (Using in VB.NET) to call the Dispose method when the execution path clears the using block (even if it's because of an exception).
Using this approach, a DatabaseMetric can be recorded for any operation by surrounding it by the using block in the above example.