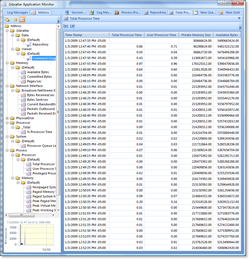
A metric grid shows the raw numeric values behind sampled and event metrics. Like the Metric Graph, you add metrics by dragging and dropping them from the Metric Tree View onto the grid. The first metric that is dropped on the grid determines the type of data in the grid.
- If it's an event metric, all data points in the event metric are added to the grid, and no additional metrics can be added.
- If it's a sampled metric, additional metrics can be added to the display and will result in additional columns being added to the graph. The additional metrics will be rationalized to the time stamps already present, creating additional points before and after as necessary.

Metric Grid |
Creating a new Metric Grid
To create a new Metric Grid, click on the New View button on the left of the tool bar and then the New Grid button in the New View Dialog. This will create a new, empty grid ready for metrics to be added. Multiple metric grids can be used at the same time for a session.
Working with Event Metrics
When an Event Metric is placed in the grid some additional options are available to enable rapid analysis of the event metric data:
- Automatic Summarization: Each value is summarized according to its configuration with the summary value displayed as the last row of the data. For qualitative (non-numeric) data, the count of events is displayed.
- A numeric column can be selected for Analysis: For each data group the average, min, and max of this value are displayed in the group header.
Analysis is most useful when grouping the metric rows by one or more columns. You can group by a column quickly by right-clicking on any cell in the column and selecting Group By <column name> from the context menu.
Customization
The Metric Grid supports a number of operations to filter data which can be found by right-clicking on the grid.