Loupe uses Event Metrics to capture details about singular events that occur as your application runs. They provide high resolution telemetry on key events - like database calls, controller hits, and other actions. Ideally, you want to record an event every time your application reaches out of process or is invoked from another process at a minimum: These will give you the high level view of how your application is scaling and performing.
In this example, we will define a custom event metric for capturing JDBC call information. We want to record the SQL Text, result size, duration, and any error for each database call.
Defining an Event Metric
The simplest way to define metrics is to use annotations on a DTO that contains the data we want to record. In the example below we create a DTO that supports auto-close behavior and have it contain all of the information we want to record:
@EventMetricClass(namespace = "yourApplicationName", categoryName = "Database",
counterName = "Query", caption = "Database Query Performance",
description = "Performance data for every database query")
public class DatabaseMetric implements Closeable {
    private String query;
    private int rows;
    private Instant startTime;
    private Duration duration;
    private String result;

    public DatabaseMetric(String query) {
        super();
        this.query = query;
        this.result = "Success";
        startTime = Instant.now();
    }
    @EventMetricValue(name = "queryName", summaryFunction = SummaryFunction.COUNT,
caption = "Query Name",
description = "The name of the stored procedure or query that was executed")
    public String getQuery() {
        return query;
    }
    public void setQuery(String query) {
        this.query = query;
    }
    @EventMetricValues({@EventMetricValue(name = "duration", summaryFunction = SummaryFunction.AVERAGE, unitCaption = "ms",
caption = "Duration",
description = "Duration of the query execution", defaultValue = true)})
    public Duration getDuration() {
        return duration;
    }
    public void setDuration(Duration duration) {
        this.duration = duration;
    }
    @EventMetricValue(name = "result", summaryFunction = SummaryFunction.COUNT,
caption = "Result",
description = "The result of the query; Success or an error message.")
    public String getResult() {
        return result;
    }
    public void setResult(String result) {
        this.result = result;
    }

    @Override
    public void close() throws IOException {
        duration = Duration.between(startTime, Instant.now());
        EventMetric.write(this);
    }
}
Recording Samples
To record an instance of this metric every time a database call is made, we route our database calls through an execute method with the metric added in a try block:
private ResultSet executeQuery(Connection connection, String query) throws Exception {
    try (PreparedStatement ps = connection.prepareStatement(query)) {
        // Execute the provided command wrapped in our metric
        try (DatabaseMetric ourMetric = new DatabaseMetric(query)) {
            try {
                return ps.executeQuery();
            } catch (Exception e) {
                // record the error info in our metric and then re-throw the exception.
                ourMetric.setResult(e.getMessage());
                throw e;
            }
        }
    }
}
private void executeUpdate(Connection connection, String query) throws Exception {
    try (PreparedStatement ps = connection.prepareStatement(query)) {
        // Execute the provided command wrapped in our metric
        try (DatabaseMetric ourMetric = new DatabaseMetric(query)) {
            try {
                ps.executeUpdate();
            } catch (Exception e) {
                // record the error info in our metric and then re-throw the exception.
                ourMetric.setResult(e.getMessage());
                throw e;
            }
        }
    }
}
Analyzing Event Metrics
By capturing this information, the Loupe Desktop can quickly show you a range of charts such as:
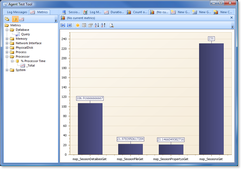
- Average Duration by Query: The average duration for each query (grouped by Query Name) that was run in the session.
- Result by Query: A bar chart of the number of different queries that produced each Result.
- Top 5 Queries: A pie chart with the top five queries.
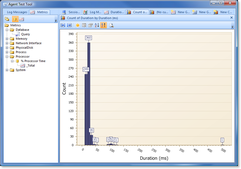
- Count by Duration: See the distribution of query duration to understand the variance from query to query.
Example Chart: Average Duration by Query

Example Average Duration by Query Chart |
Example Chart: Count by Duration

Example Chart: Count of Duration |
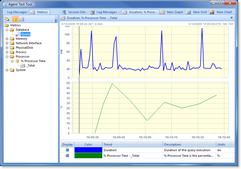
In addition to these charts, you can treat any value in an event metric like a sampled metric and create a graph of that value by time, such as:
- Average Duration by Time: Viewing across the life of the session, graph the average query duration.
- Average Rows by Time: Viewing across the life of the session, graph the average number of rows returned by a query.
In each case, you can then add other sampled metrics to the same graph such as processor or memory utilization.
Example Graph: Average Duration by Time

Examle Average Duration by Time Graph |