Loupe Desktop - Log Messages Grid - Filtering Messages
In This Topic
To help you find the right information to understand what is happening in your application Loupe provides a number of filtering, grouping, and sorting capabilities:
- Dynamic Filtering: Within the grid itself you can add an additional filter on any column, usually by right-clicking on a value that you either want to exclusively display or hide.
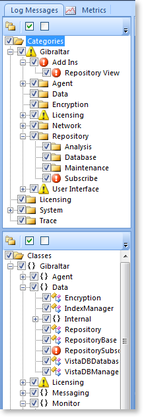
- Filter by Category: You can use the category tree view to restrict the messages included in the display.
- Filter by Class: The class tree view displays the classes organized by namespace that recorded messages and works identically to the Category tree.
- Filter by Text: Type a partial value in the filter box to restrict the log messages to just those containing this text somewhere in their caption or description.
- Filter by Thread: A checked listbox displays all of the threads from the application. Check or uncheck each thread to show or hide its log messages.
- Filter by User: Show all users, just one user, or one user and the process identity.
- Messages by Severity: You can select the minimum severity of messages displayed to rapidly hide less important messages.
Dynamic Filtering
The grid supports rapid filtering through its context menu. When you right-click on a cell with data it will present you with context sensitive options.
- For Numeric & Date types: Less than or equal and greater than or equal the value of the current cell
- For Strings: Matching or not matching the value of the current cell
These options are independent of the other filtering options.
Creating and editing Complex Dynamic Filters
You can manually edit the current dynamic filter by using the dynamic message filter editor that displays immediately above the grid:

Filtering by Category and Class

In the filter panel to the left of the log message display is the Category and Class tree views that provide rapid filtering to some or all of the log messages based on the class and category they are in.
To filter the display, click on a checked box to uncheck that item and all of its children.
To quickly expand/collapse the tree or check/uncheck all items use the toolbar.
If a Category or Class contains a warning, error, or critical message its icon will reflect the most severe status it contains. The trees automatically open to show all of the items that contain errors & critical messages to help you rapidly identify the problem areas.
Quick Navigation
If you click on a node that has a warning, error, or critical icon the message grid will move to the next message that it contains with the indicated severity. For example, you can jump strait to the first error in a category by clicking on the category showing an error icon.
Highlighting Records
When you click on any category or class node all of the messages it contains will be highlighted. The highlighting will stay even when focus shifts to the grid unless you click on the root node (labeled Categories and Classes).
Filtering by Thread
In the filter panel to the left of the log message display is a collapsible Thread Filter. The list of all threads that recorded information in the session is displayed. Check or uncheck threads to show or hide their data. Use Control-A to select all threads to change them as a group.
Filtering by User
When a session contains information from multiple users the Filter panel is visible, offering the options to display all users, just a single user, or a single user plus the process user. This is optimized for following a single user throughout a session without having to first find an example of the user's identity to use in a dynamic filter.
If the application implements extended Application User data capture then the additional information is displayed in the user selector to make it easier to find the correct user to filter by.
See Also

