Developer's Guide - Metrics - Performance Counters
In This Topic
By default the Loupe Agent records performance information for the application whenever it is active. The performance metrics show up in the Loupe Desktop with all the other metrics and can be graphed along with your custom event and sampled metrics. This information is very compact and is automatically polled on a sliding schedule to provide the most samples when the process first starts (polling every five seconds) and eventually dropping down to a rate of once a minute.

Performance Counter Graph |
What Information is Gathered?
For Each Hard Drive
- % Disk Time
- % Free Space
- Average Disk Queue Length
- Average Disk Seconds per Transfer
- Disk Transfers/sec
- Disk Bytes/sec
- Disk Reads/sec
- Disk Writes/sec
- Free Megabytes
For Each LAN Network Interface
- Bytes Received/sec
- Bytes Sent/sec
- Current Bandwidth
- Packets Received Errors
- Packets Outbound Errors
Machine-wide Performance
- Processor Queue Length
- % Processor Time: The total time used by all processes on the computer.
- Committed Bytes
- Available Bytes
- Pages / sec
For the process that is hosting the application
- Total Processor Time: User and privileged time for the process
- User Processor Time
- Privileged Processor Time
- Nonpaged System Memory Size
- Paged System Memory SIze
- Paged Memory Size
- Peak Paged Memory Size
- Peak Virtual Memory SIze
- Peak Working Set
- Private Memory SIze
- Virtual Memory Size
- Working Set
Detailed Memory Counters
The Agent supports an option for gathering an extended set of .NET-specific performance counters designed to assist in tracking down memory leaks. The set of counters included is:
- .NET CLR Memory/# GC Handles
- .NET CLR Memory/# Bytes in all Heaps
- .NET CLR Memory/# Gen 0 Collections
- .NET CLR Memory/# Gen 1 Collections
- .NET CLR Memory/# Gen 2 Collections
- .NET CLR Memory/Large Object Heap Size
- .NET CLR Memory/Gen 0 heap size
- .NET CLR Memory/Gen 1 heap size
- .NET CLR Memory/Gen 2 heap size
- .NET CLR Memory% Time in GC
The option is not enabled by default. To enable it, set the EnableMemoryPerformance option to true.
How the Information Is Gathered
Once the agent starts, a dedicated background thread is created to poll these counters on a sliding interval (starting quickly and slowing down over time). This, along with extensive error handling, ensures that it will not interfere with the performance or reliability of your application. If the counters are not available due to machine configuration or security problems then the counters are excluded from the set and not polled.
| Session Time Frame | Polling Interval |
|---|---|
| Start through 120 seconds (2 minutes) | 5 seconds |
| 2 minutes to 60 minutes | 15 seconds |
| 60 minutes to end of session | 60 seconds |
User Permissions Required for Performance Counters
On Windows by default not every user can read performance counters. In particular, the Disk, Network, and Machine-wide counters identified above require the user be a member of the Performance Monitor Users group. If not then a warning is written to the log when the Agent starts indicating it can't access the counters:
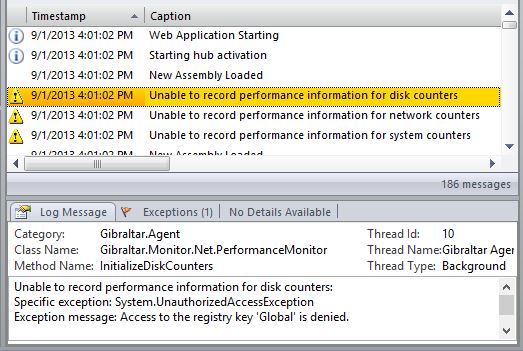
Web Applications that are run as the application pool user will typically not be a member of this group, similarly low-privilege users.
Local group membership is only updated when a user logs into the operating system, and in the case of services only the first time after startup. Therefore, you may have to restart the server for the change to take effect for web sites and services.
How much Space does it Take
Each Performance Counter sample takes about 85 bytes. This leads to a long term average of about 5KB/hour per metric. Because of the faster sampling rates in the first hour more space is used (but just for the first hour).
See Also