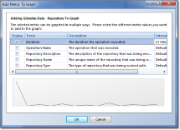
When adding an Event Metric to a Metric Graph, a dialog is displayed to allow you to select which values to display on the graph and how to translate the raw data to the graph.

Adding Event Metric to a Metric Graph |
You can select multiple individual values to display and indicate the sampling interval to group the individual event metrics into. You can see a preview of the selected event metric value's data in the lower part of the dialog.
Why adjust the Interval?
Changing the interval can substantially change the displayed curve for event metrics because it affects how many samples are being averaged, summed, or counted in each interval. For example, if looking at the average duration the longer the interval the more outlying values will be damped down to create a smoother line. Often it is useful to establish a standard interval to enable fair comparison between sessions.
To adjust an interval, click the ellipsis button to the right of the current interval label.